Detection was not the decision
Watchdog V1 answered an important question reliably: is this movement unusual enough to deserve attention? It separated point shocks from persistent trends, compared like weekdays with like weekdays and rejected incomplete observations.
But a Red metric still opened an hour of work. A seven-person, cross-functional pricing huddle could spend most of the morning moving between dashboards—confirming the movement, locating the affected cohort, estimating whether it mattered, debating familiar explanations and finding the right owner.
I built Watchdog V2 to move that investigation forward before the meeting began. For every eligible alert, it asks:
- What changed?
- Where is the movement concentrated?
- How much business is exposed?
- Which explanations fit the evidence?
- What contradicts the obvious story?
- What should be checked next?
It is not an automatic root-cause generator. It is a diagnostic system designed to give humans a better first investigation.
Diagnosis is an inverse problem
A marketplace outcome is assembled from interacting systems. Demand can fall while conversion improves. Supply can look stable while the relevant choices disappear. Displayed prices can move because pricing changed—or because the mix of cars, durations and locations changed. A late journey failure can resemble a commercial problem. A campaign can shift timing without causing the alert.
Several mechanisms can therefore produce the same top-line symptom, and one mechanism can affect several metrics. Diagnosis is an inverse problem: infer a small set of plausible mechanisms from incomplete, noisy observations without pretending that correlation is causal proof.
V2 begins with the exact successful V1 run and the branch that fired. Point and trend evidence stay separate. A signal becomes eligible only when its geography, cohort, reference dates and time window match the alert. That prevents a convenient but misaligned fact from becoming an explanation.
- DETECTPreserve the exact V1 alert and point-or-trend branch
- SCOPELocate the market, journey and behavioural cohort
- REASONTest competing explanations and retain contradictions
- PRIORITISEPlace business exposure beside the statistical signal
- INVESTIGATERecommend a next check, not an automatic intervention
The reasoning contract
The statistical ingredients are deliberately conventional: comparable-weekday references, pooled rates, log residuals, robust dispersion, persistence, practical effect size and sample exposure. The difficult work was making those measurements mean the right thing together.
V2 evaluates nine headline-eligible reasoning families plus one context-only relationship. The internal thresholds and selection configuration remain private; the public contract is more useful:
| Evidence lens | What it may suggest | What it cannot establish |
|---|---|---|
| Availability and choice | The relevant choice set weakened | That every missing choice would convert |
| Commercial presentation | Price or offer presentation deserves inspection | Elasticity or the correct intervention |
| Late journey | The break concentrates after earlier stages | A technical cause without telemetry |
| Incoming demand | Lower traffic contributes to value loss | Why demand changed |
| Booking composition | Duration or value mix shifted | A configured price change |
| Event normalisation | Performance may be returning from a peak | That remaining weakness is healthy |
| Neighbouring cohorts | Demand may have redistributed | Customer switching without disjoint populations |
| Anticipated events | Customers may be delaying progression | Intent from calendar overlap alone |
| Campaign normalisation | Demand changed after campaign activity | Causality without a clean reference |
| Price/outcome co-movement (context only) | A relationship deserves investigation | A headline, elasticity or causal direction |
Same-scope directness and alert-branch coverage determine explanatory rank. Context can inform a case but cannot create or strengthen the headline. Business exposure determines investigation priority, not causal likelihood. Related signals corroborate a direction; they are not automatically counted as independent proof.
Sometimes the correct output is: the movement is real and material, but the available evidence does not identify the mechanism. No match never means no problem.
A representative investigation
Consider a directionally faithful composite with identifying details removed. V1 identifies an adverse conversion movement in a weekend, mid-duration cohort, alongside a value branch that also needs explanation. A recent promotion makes pricing the convenient story.
V2 reconstructs the scope instead. Earlier journey stages remain within their expected range while a later stage weakens. Comparable displayed-price evidence runs against the high-price narrative. The promotion overlaps only part of the affected cohort, and another alert branch remains uncovered.
The output does not say “pricing caused conversion to fall.” It keeps pricing as context, ranks the late-journey break as the stronger first direction, exposes the unexplained branch and asks for the matching operational telemetry. Competitor prices, current campaign conditions and marketplace nuance still belong in the human decision.
That is the value of the system: not a polished guess, but useful discrimination between what deserves investigation, what conflicts with it and what is still unknown.
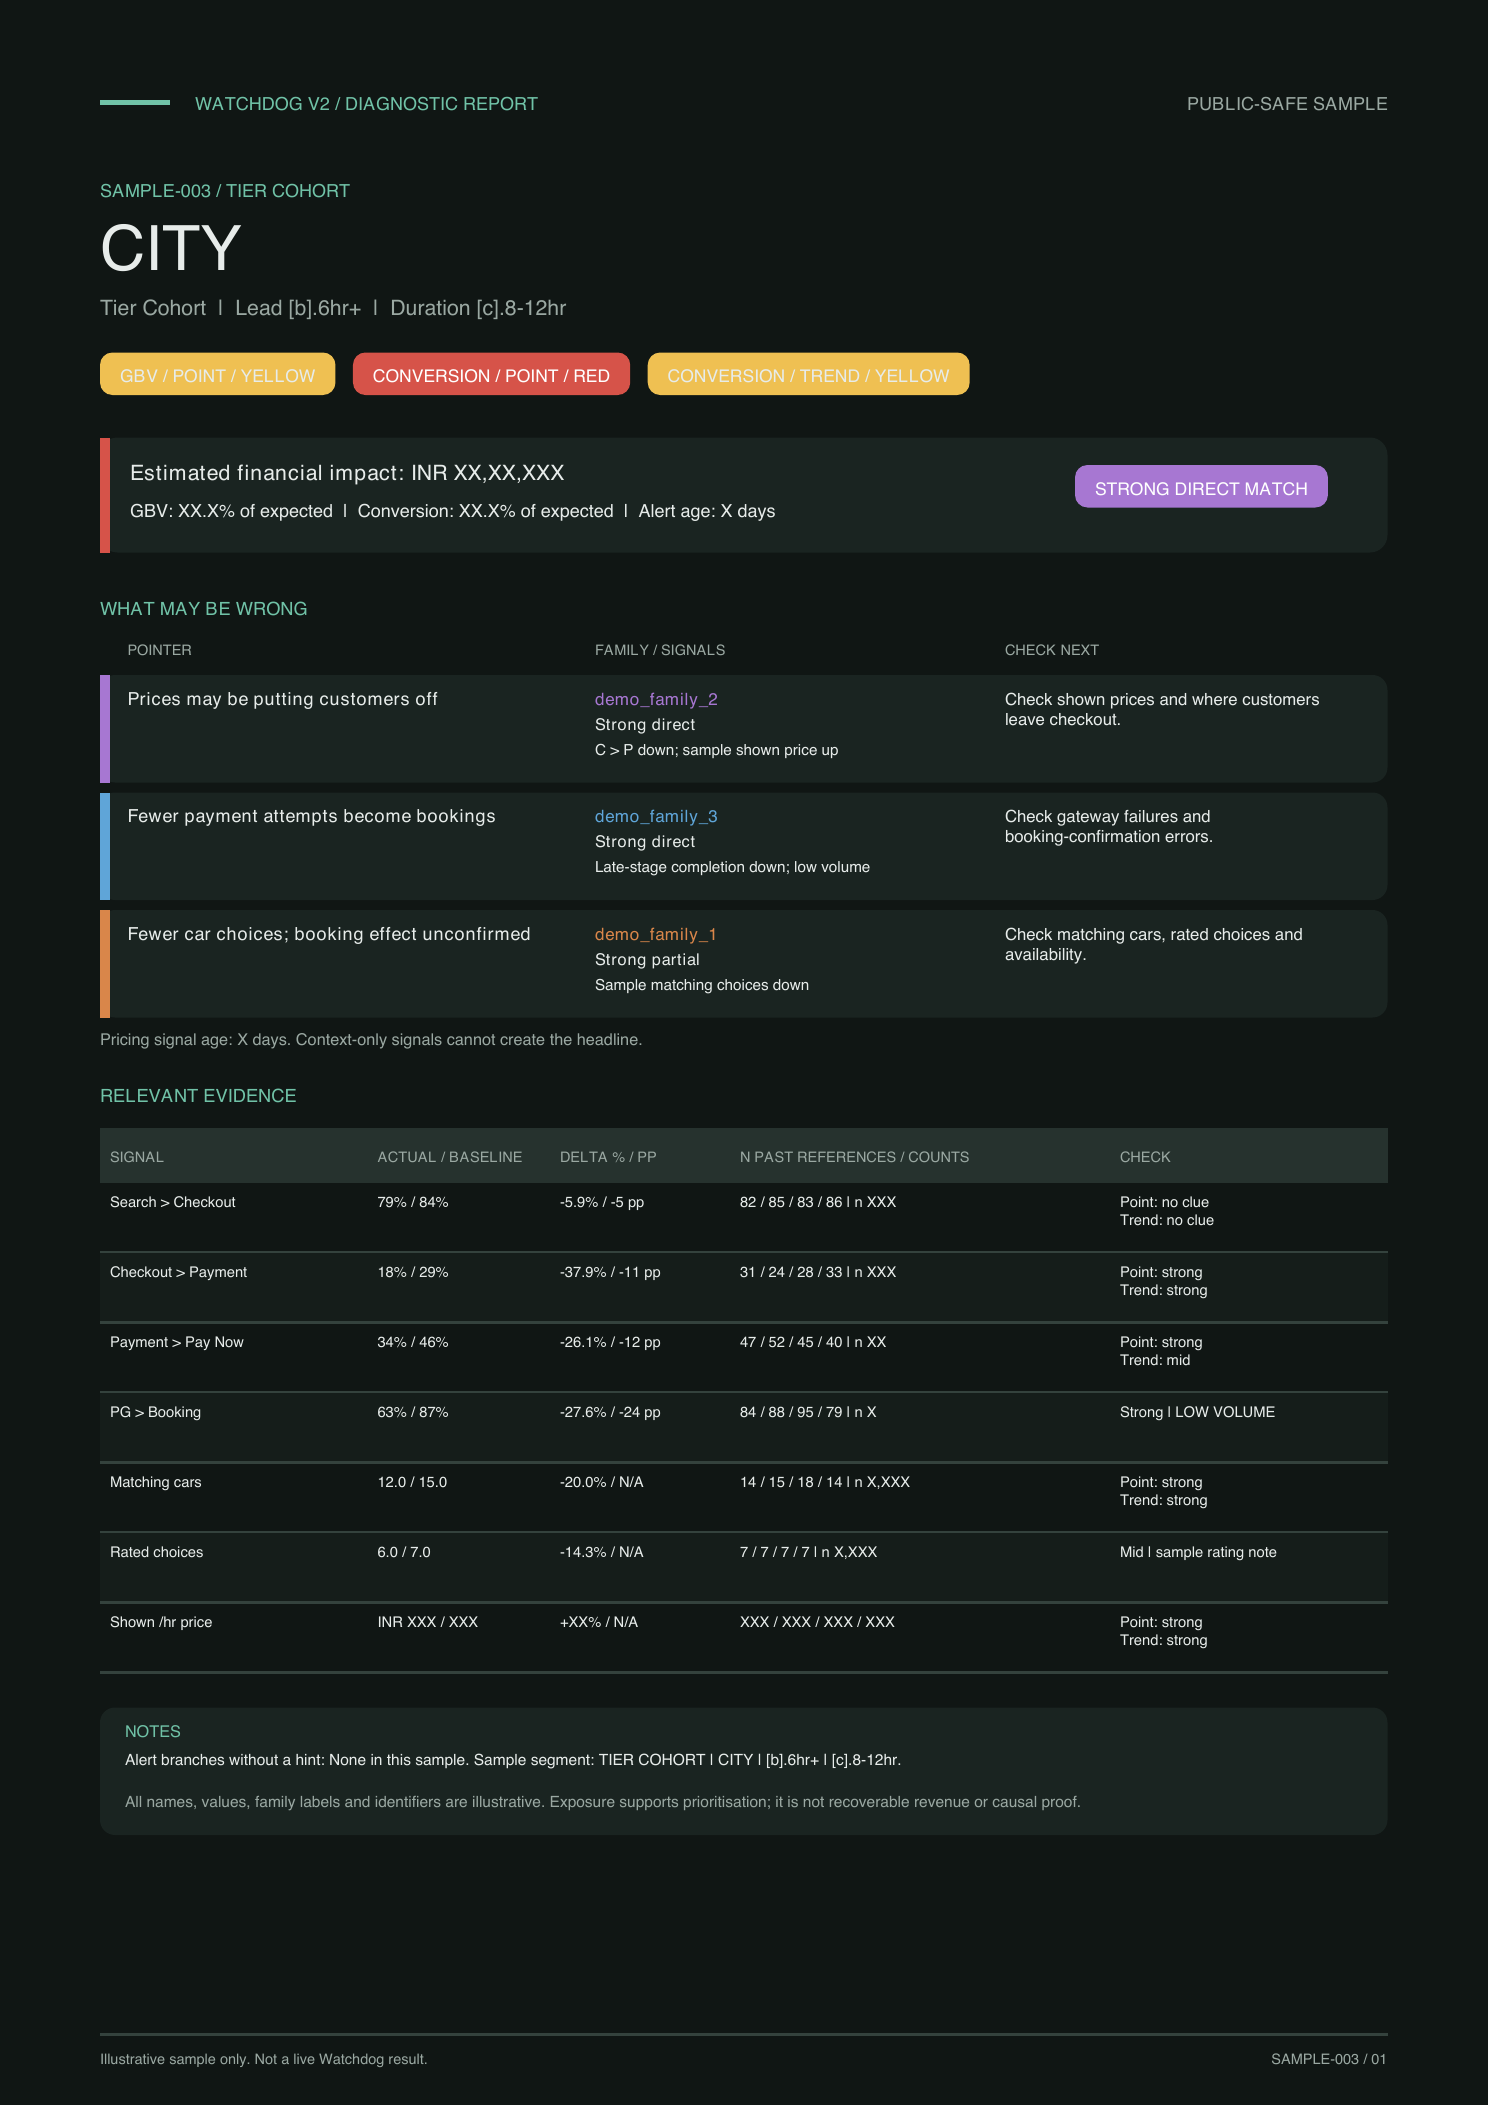
Every alert receives its own page-level investigation like the public-safe sample below. Related branches for the same cohort stay together, so the reader sees what changed, estimated exposure, plausible directions, contradictory or weak evidence, next checks and the underlying data in one place.
Impact without invented precision
A dramatic percentage on a tiny denominator should not outrank a modest movement carrying substantial business. V2 therefore keeps sample exposure and commercial exposure beside every diagnosis.
For a conversion movement, the prioritisation bridge is approximately:
exposed value ≈ current demand
              × gap from expected conversion
              × expected value per booking
Compatible exposure estimates are not added when they describe overlapping loss. The result is for prioritisation—not revenue guaranteed to be recovered and not proof that a proposed intervention caused the outcome.
Operationally, V2 created a choice between time and throughput:
- On a routine day, the huddle could review the same roughly 10 priority cases in about 20 minutes instead of close to 60.
- On a high-volume day, it could retain the full hour and triage 22–25 or more cases—about 2.2–2.5× the previous throughput.
The longer sitting is slower per case because straightforward items leave the queue first and the remaining cases require more discussion. A “case” here means a cohort-alert item that received a scope, exposure, initial investigation and owner—not a resolved incident.
If every day followed the routine-load pattern, the shorter meeting would release up to 93 participant-hours of monthly capacity across seven people and 20 operating days. High-volume days use that capacity for additional cases instead, so the benefits are not double-counted.
More importantly, the review no longer begins by eyeballing charts and arguing from whichever movement looks largest. The team begins with qualified evidence, prioritises the largest exposure and assigns the right owner.
Built with the people who use it
I designed and built V2 on top of Watchdog V1 and the existing data platform, then refined it through repeated working sessions with analysts and business operators. We replayed known periods, reconciled metric definitions, challenged explanations that sounded plausible but were poorly supported and tuned both evidence eligibility and reporting language.
Before daily adoption, V2 was exercised across a 57-alert historical replay and reviewed with analysts and business operators. The review deliberately included point and trend alerts, sparse cohorts, unavailable sources, contradictory evidence and cases where no explanation should be retained. The objective was not maximum match coverage. It was whether the report produced a more useful first investigation while making its uncertainty visible.
Because one alert can contain several branches and candidate explanations, the review unit was a cohort-reason decision, not the alert itself. Across 100 such decisions, V2 surfaced 86 supported directions and correctly withheld an explanation in nine out-of-scope cases. Review found two unsupported directions and three supported directions the system missed.
That error profile made the operating tradeoff concrete. An unsupported direction can send seven people toward the wrong owner, encourage an unnecessary intervention and quickly erode trust. A missed direction can leave a material mechanism undiscovered. V2 therefore prefers a qualified partial or an explicit “no supported explanation” over a confident but weak story, while keeping the unexplained branch visible.
The engineering follows the same discipline. V2 runs against the exact successful V1 run. Reference dates, sample exposure, quality flags, rule version, contradictions and unavailable results are stored with every diagnosis. Negative results are persisted too. Email and PDF render from that stored evidence rather than recalculating it, so a polished report cannot silently diverge from the run that produced it.
After trial runs and calibration, the team adopted the system in the daily pricing workflow. It did not remove judgement from the room. It gave judgement a reproducible place to begin.
What V2 actually changed
The formulas are not the novelty. The contribution is the system around them: years of marketplace context translated into explicit evidence boundaries, robust measurement, conflict handling, operational recovery and a report that helps people act without hiding uncertainty.
Watchdog V1 tells us when something deserves attention. V2 tells us what moved, where it moved, how much it may matter, which explanations have earned weight, what remains unexplained and where to look next.
That is enough to transform a morning conversation—from broad debugging and instinctive stories into a focused, evidence-led investigation—without pretending the machine has the final answer.